Charts
Charts are the investor's best friend on
the stock or crypto market. As an investor, you'll probably use charts more often than
other available tools. As the charts will probably play a significant role in
your investments, it is necessary to familiarize yourself with them. The more
comfortable you feel using the charts, the better you will be an investor.
To help you get acquainted with and
effectively use charts, we will further develop the following concepts:
- Rules for creating charts
- Time periods of charts
- Types of charts
Chart options
Let's start with the basics and look at
how the price charts are created. When you understand the basics, you
will be more successful in applying the more advanced concepts of technical
analysis.
- The graph consists of two axes: the X
axis (horizontal) and the Y axis (vertical).
- The X axis runs horizontally along the
chart, indicating the time of price changes that have occurred on the selected
instrument.
- The Y axis runs vertically along the
left part of the graph, showing the price movement on the chart. Lower prices
are at the bottom of the axis, higher at the top.
- When you put together the X axis with the Y
axis, you'll see the exact stock prices in the time period you have chosen in
the past.
Time periods of charts
Charts allow you to analyze the movement
of prices of shares selected by you in different time periods:
- Minutes
- Hourly
- Daily
- Weekly
- Monthly
If you are a short-term player, you will
use shorter periods in your charts. In the case of a long-term approach, charts
with a larger time range may be used. For example, an investor wishing to make
a quick transaction with a profit of 10-20 cents will probably use minutes charts.
An investor who wants to keep positions for much longer, uses hourly or even
daily charts.
Some investors use charts with different
periods at the same time, so that they can watch the movement of prices from
different points of view. We will discuss this concept later.
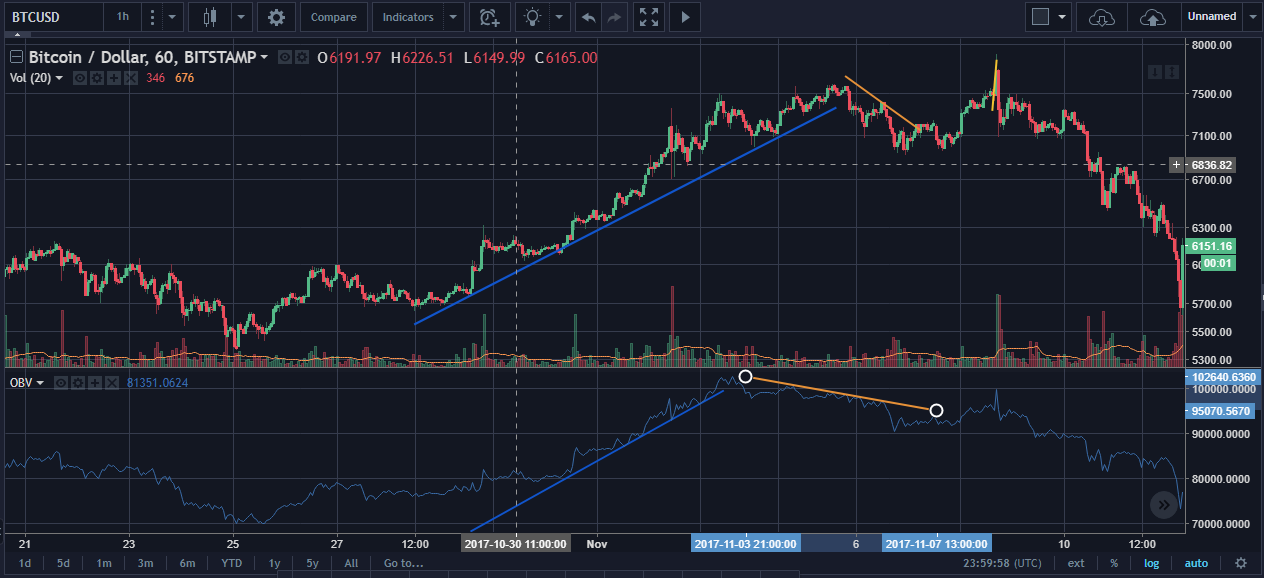
Types of charts
Charts give you the opportunity to
analyze the price movements of any action in various formats: line charts, bar
graphs, candle charts. You have the option of choosing a way of presenting the
data that suits you best.
Technical analysis is a visual, almost
artistic, skill that investors develop by trying different variants. Some
believe that they can better determine support or resistance levels in line
charts, while others believe that candle charts provide more information.
Technical analysts usually use one of
the following three chart types:
Line graph
Line charts are the most basic type of
chart. Technical analysts often use these kinds of charts to identify support
or resistance levels more easily. These charts contain only basic information.
Creating a line chart involves combining
all courses, e.g. closing or opening. Line charts can also show all
transactions that took place in a given period (intraday charts). The line
chart (intraday) is shown in the following illustration.
A bar graph
Bar charts provide more information than
line charts. Technical analysts often use charts of this type to observe how
prices changed during each period in the chart. While the line graph only shows
closing rates, the bar chart also shows the opening price, maximum and minimum
values for each period.
Creating a bar graph involves drawing a
series of bars along the graph. Each bar represents one period. To create a
bar, it is necessary to draw the maximum and minimum price from the selected
period. Then, mark the opening price on the left side of the post with a
horizontal line and the closing price on the right.
The opportunity to see the opening level
of the selected period for a given company and the closing level allows better
identification of trends. If the price closes higher than the opening, it means
that demand for the selected period prevailed. Conversely, when closing below
the opening level.
Candle chart
Candle charts provide the same
information as bar charts, but in a slightly different format. Technical
analysts very often use candle charts as a replacement for bar charts, mainly
due to the ease of identifying different patterns of market behavior. In fact,
on the basis of this kind of charts, the field of chart analysis was created.
Creating candle charts is about
sketching the next candles along the chart. Each candle represents one period.
Creating a candle consists in drawing a vertical line connecting the maximum
and minimum for a given period. This line is called the candle's shadow. Then,
use horizontal lines to open and close and fill in in sequence.