
Showing posts with label Indicators. Show all posts
Showing posts with label Indicators. Show all posts
Stochastic Oscillator
A stochastic oscillator
The Stochastic Oscillator (Stochastic) is obtained by
calculating the exponential averages from the % K index, which is a current rate of the cryptocurrency.
To analyze this oscillator, it is necessary to determine the
levels of overbought and out-sell. The overbought level is usually set at 90%
and the selling level at 10%.
a stochastic oscillator.

A buy signal is generated when
the ratio increases above the sell-out level and the averages cross.
The sales signal is generated when the indicator drops
below the overbought level. As you can see only buy signal is reliable when it comes to Bitcoin.
Rate of Change ROC
ROC change rate
ROC (Rate of Change) is next to MACD the most used indicator
of technical analysis.
To analyze this indicator, it is necessary to determine the
overbought and oversold levels. These levels should be set so that in the area
between them there was approx. 90% of the indicator's progress. The upper limit
of this area is determined by the overbought level (mine is set at 60), while the lower limit is
the sell-out level (mine is set at -20).

The buy signal is generated with the indicator rising
above the sell-out level -20.
The sales signal is generated when the indicator drops
below the overbought level 60.
Commodity Channel Index CCI
CCI (Commodity Channel Index)
The CCI oscillator is most often
used to determine buy signals. CCI is most often analyzed based on the signal lines line (moving averages).
It is also possible to analyze the ratio based on the overbought
/ oversold levels (see ROC). The characteristic feature of CCI is that it
usually generates buy signals earlier than other indicators.
The buy signal is generated when the 9MA of CCI Index crosses 14MA of CCI (at a very low level).

Volume
Trading volume
Investors assessing the situation on
futures or crypto markets usually use the three-volume method - price, volume and number
of open orders. It is estimated that the price is the most important. The
volume and number of open interests are usually treated as confirmation
indicators, with the volume being more important.
The number of open interests or orders ranks third. Analytical research proves that apart from the observation of
price movements, tracking of volume and the number of open interests sometimes brings important indications as to the direction of the market. With
this in mind, a diligent investor should follow all these values. The volume is
the number of exchanges or contracts concluded in the defined period. The number of open interests is the number of non-liquidated contracts or book orders by the end of the period.
Tips for interpreting the volume and number of open orders.
Investors should observe changes in the volume
and number of open book orders when assessing the market condition. The general
rules for interpretation are presented below:

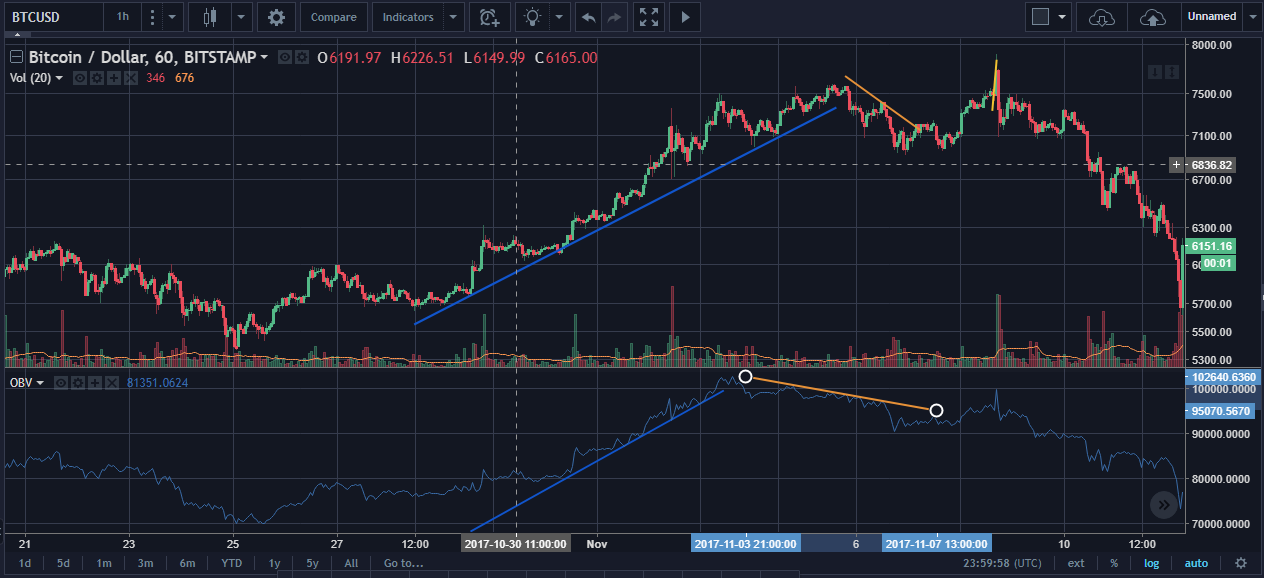
OBV (On Balance Volume) line
The OBV line works well to analyze the
capital flow accompanying the price movements. The construction of
the OBV line is quite simple. Depending on changes in the price (increase
or decrease), the volume is assigned a positive or negative value,
respectively. The increase in the crypto price translates into recognition
of the volume with the positive sign, while the price decreases the
negative volume.
We receive current cumulative balances by adding or
subtracting the volume from each day, depending on the direction of the
price. The rate does not matter in the case of OBV
lines, while the direction of the OBV lines is important. When analyzing the
OBV curve investors should use the trend line too.
RSI
The
RSI (Relative Strength Index) indicator gives quite good signals at the time
when a given action is in a horizontal trend. RSI simply gives the trader idea
of the speed and change of the price movements.
To
analyze chart using this indicator, it is necessary to determine the overbought
and oversold levels. The overbought level is usually set at 70-80% and the
sell-out level at 20-30%.

Let’s look at the LTCBTC
4hour chart.
The buy signal (B) is
generated with the indicator rising above the sell-out level.
The sales signal (S) is generated
when the indicator drops below the w level.
We can notice that the LTCBTC has formed a
horizontal price action. Based on that scenario, you would build up you
position whenever RSI is below 30 and sell some of your position (eg 25% of all
holdings) every time RSI reaches 70.
Learn how RSI is calculated here
MACD
MACD (Moving Average Convergence Divergence) is one of the most commonly used indicators. Its popularity results from the ease of interpretation and the possibility of using the indicator both in the period of stabilization and clear increases or decreases in prices.

The buy signal (B) is generated when the MACD hits the bottom and 12 period moving average crossed and is above 26 period MA.
The sales signal (S) is generated when the MACD raises to the top and 26MA crossed and is above 12MA.
The buy signal should be generated below the zero level and the sales signal above this level.
To understand it better, check out this video:
Moving Averages
Moving Averages
One of the first indicators used in the technical analysis was the Moving Average. This simple indicator sometimes generates very good signals, That’s why it is important to use it correctly. The use of a brother or shorter moving averages is a subject to the individual strategy, by going long you would look at the 200day moving average, by doing day trading you would look at let’s say 9hour MA.

By looking at this picture you can notice that a particular coin is most of the time moving back toward the MA curve(s). This phenomenon is known as a mean aversion. By buying a coin below or above MA you can be almost certain that the price will move toward that MA. Price is very responsive to the blue curve (7 period), less responsive to the yellow (25) and the least to purple (99). The sorter MA the more responsive. You should use different lengths of MA depending on your strategy. 9 hour moving average if you are a day trader. 99 day moving average if you are a long-term investor. Moving averages can be a good tool in determining value of the currency or bearish vs. bullish trends.
Subscribe to:
Posts
(
Atom
)