
Showing posts with label Technical Analysis. Show all posts
Showing posts with label Technical Analysis. Show all posts
Stochastic Oscillator
A stochastic oscillator
The Stochastic Oscillator (Stochastic) is obtained by
calculating the exponential averages from the % K index, which is a current rate of the cryptocurrency.
To analyze this oscillator, it is necessary to determine the
levels of overbought and out-sell. The overbought level is usually set at 90%
and the selling level at 10%.
a stochastic oscillator.

A buy signal is generated when
the ratio increases above the sell-out level and the averages cross.
The sales signal is generated when the indicator drops
below the overbought level. As you can see only buy signal is reliable when it comes to Bitcoin.
Rate of Change ROC
ROC change rate
ROC (Rate of Change) is next to MACD the most used indicator
of technical analysis.
To analyze this indicator, it is necessary to determine the
overbought and oversold levels. These levels should be set so that in the area
between them there was approx. 90% of the indicator's progress. The upper limit
of this area is determined by the overbought level (mine is set at 60), while the lower limit is
the sell-out level (mine is set at -20).

The buy signal is generated with the indicator rising
above the sell-out level -20.
The sales signal is generated when the indicator drops
below the overbought level 60.
Commodity Channel Index CCI
CCI (Commodity Channel Index)
The CCI oscillator is most often
used to determine buy signals. CCI is most often analyzed based on the signal lines line (moving averages).
It is also possible to analyze the ratio based on the overbought
/ oversold levels (see ROC). The characteristic feature of CCI is that it
usually generates buy signals earlier than other indicators.
The buy signal is generated when the 9MA of CCI Index crosses 14MA of CCI (at a very low level).

Volume
Trading volume
Investors assessing the situation on
futures or crypto markets usually use the three-volume method - price, volume and number
of open orders. It is estimated that the price is the most important. The
volume and number of open interests are usually treated as confirmation
indicators, with the volume being more important.
The number of open interests or orders ranks third. Analytical research proves that apart from the observation of
price movements, tracking of volume and the number of open interests sometimes brings important indications as to the direction of the market. With
this in mind, a diligent investor should follow all these values. The volume is
the number of exchanges or contracts concluded in the defined period. The number of open interests is the number of non-liquidated contracts or book orders by the end of the period.
Tips for interpreting the volume and number of open orders.
Investors should observe changes in the volume
and number of open book orders when assessing the market condition. The general
rules for interpretation are presented below:

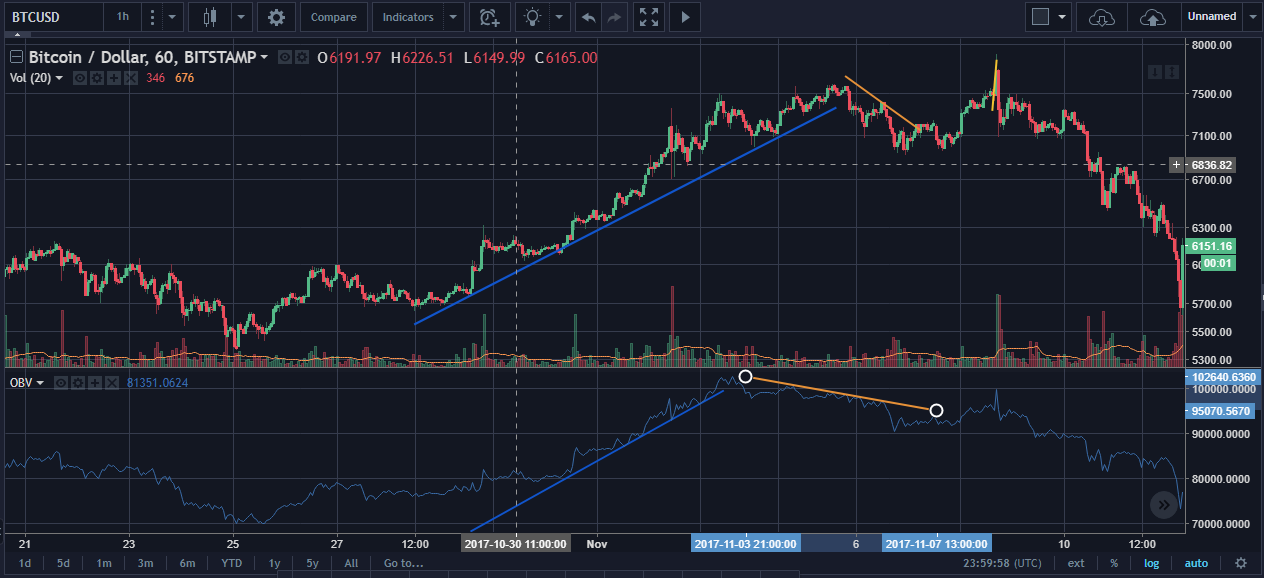
OBV (On Balance Volume) line
The OBV line works well to analyze the
capital flow accompanying the price movements. The construction of
the OBV line is quite simple. Depending on changes in the price (increase
or decrease), the volume is assigned a positive or negative value,
respectively. The increase in the crypto price translates into recognition
of the volume with the positive sign, while the price decreases the
negative volume.
We receive current cumulative balances by adding or
subtracting the volume from each day, depending on the direction of the
price. The rate does not matter in the case of OBV
lines, while the direction of the OBV lines is important. When analyzing the
OBV curve investors should use the trend line too.
Flags and Pennants
Flag and Pennant
Flag
The flag is one of the most
"secure" formations. It is most often formed in the timeline from 3 to
4 weeks for stocks and 1 to 2 days for crypto and occurs after a very fast (almost vertical) price movement. The flag
announces the continuation of traffic in a given direction.

During the formation of the flag, the volume of turnover
should decrease very clearly. The range of movement after breaking from the
formation should be at least equal to the size of the movement to reach it,
measured from some characteristic point - eg from breaking from the previous
formation or breakthrough of resistance level (measurement of movement is
marked with a vertical purple line). Perfectly in line with the pattern, the
flag announces the continuation of the specified range with a probability of up
to 90%.
When assessing the correctness of the flag, remember that:
- formation should occur after almost vertical movement of prices (without major corrections)
- the volume should decrease very clearly during formation formation
- if the formation takes long to establish, then it could be very suspicious. Therefore don't wait to long.
- when broken up, the volume should clearly increase.
Strategy
Price increase Flag (Figure 1)
If you have shares:
- sell if there was a distinct increase in volume during the movement that did not lead to the breakout
- sell if the break has not occurred within 3 weeks or 3 days for crypto of the beginning of the formation and the volume does not behave perfectly according to the theory
- if it breaks down, sell it immediately
If you do not have shares:
- buy after the formation of the pattern with a good volume system, do not waiting for the upward break its better to set a stop loss if broken down
Flag with access from the top (Figure 2)
If you have shares:
- sell after the formation formation (even before the break)
If you do not have shares:
- do not buy (even after breaking up)
Market example
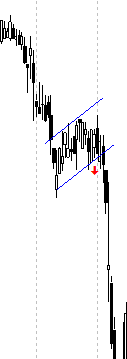
Pennants
The Pennant is next to the flag one of the most
"certain" formations. It is most often formed in the period from 3 to
4 weeks and occurs after a very fast (almost vertical) price movement.
Pennant announces the continuation of movement in a given direction.
flag formation

During the formation of the pennant, the volume of turnover
should decrease very clearly. The range of movement after breaking from the
formation should be at least equal to the size of the movement to reach it,
measured from some characteristic point - eg from breaking from the previous
formation or breakthrough of resistance level (measurement of movement is
marked with a vertical purple line). Ideally aligned with the pattern, the flag
announces the continuation of the specified range with a probability of up to
90%.
When assessing the correctness of the pennant, keep in mind
that:
- formation should occur after almost vertical movement of prices (without major corrections)
- the volume should decrease very clearly during formation formation
- the end of the formation should take place in less than 3 weeks for stocks and 3 days for crypto from the beginning of the formation - pattern longer than 3 weeks are already suspicious (the beginning of the formation was marked with the letter B in the drawing, the end with the letter E)
- when broken up, the volume should clearly increase.
Strategy
Flag with access from the bottom (Figure 1)
If you have shares:
- sell if there was a distinct increase in volume during the movement that did not lead to the breakout
- if it breaks down, sell it immediately
If you do not have shares:
- buy after the formation formation with a good rotation volume system, not waiting for the upward break (if you sold earlier - when you reach the formation, buy even at higher prices)
Flag with access from the top (Figure 2)
If you have shares:
- sell after the formation (even before the break).
If you do not have shares:
- do not buy (even after breaking up)
Market example

Wedges
Wedges
An upward wedge
An upward wedge is a
formation that "always" promises a price drop. It often develops
during short rises with long-term falls or in the last phase of the boom.
Determination of the wedge is possible only after noticing four points (1,2,3,4)
turning, which determine the upper and lower edge of the
wedge. The exit from the wedge (X) should occur not earlier than 30%
before its end (the beginning and the end define: the first point - the turning
point and the vertex. Very often, after breaking, there is a short return
movement up (marked in yellow) and only then there is a further discount. The
size of the drop is indirectly dependent on the height of the wedge.

Strategy:
If you have shares:
- sell after breaking down
Drop wedge
The discounted wedge
is a formation that "always" promises a price increase. It is more
often shaped during the medium-term adjustment of the upward trend than during
long-term decreases. Determination of the wedge is possible only after noticing
four turning points (1,2,3,4), which determine two decreasing straight lines -
the upper and the lower edge of the wedge. Breaking from the wedge (W) should
take place no earlier than 30% before its end (the beginning and the end
determine: the first point - the turning point and the vertex) and should
be confirmed by the significant increase in the volume of turnover. Very often,
after breaking, there is a correction and only after this
correction there is a proper increase. Its length is indirectly dependent on
the height of the wedge, however, the increase usually ends near the nearest
clear resistance.

Strategy
If you have shares:
- sell on 3 and buy back the shares on 4
If you do not have
shares:
- buy only after breaking up (confirmed by an increase in the volume of turnover and at the right time)
Rectangular Formation
Formation of a rectangle
Rectangles are more likely to predict the continuation of
the earlier trend than its reversal. The formation of the rectangle is
determined by horizontal lines routed by two bottoms and tops. Only after
establishing these four points can one speak of the formation of a
rectangle. Within the formation, the volume of turnover should show a downward
trend. Quite often, there are exactly six turning points before the strike
within the rectangle.

The buy signal is generated after breaking through the upper
edge, the volume must clearly increase (Figure 1). Often, after breaking, there
is a correction movement - marked in green.
The sales signal is generated after the bottom edge has been
pierced (Fig. 2). The size of the rise or fall in prices after breaking from
the rectangle should be at least equal to the height of the formation (see the
purple line in the figure).
Strategy
If you have shares:
- as soon as the formation is established (two peaks and two bottoms, i.e. after the fourth turning point), you can buy near the bottom and sell near the top
- if it breaks down from the formation, sell it immediately
- after breaking up, sell at a break and buy back on a correction
- If you do not have shares:
- in the case of a rectangle after the rise (figure 1), buy at the sixth turning point (6)
- buy only on a correction after breaking up (confirmed by the increase in the volume)
Subscribe to:
Posts
(
Atom
)