
Trend lines
The trend is the basic concept of technical analysis and
determines the direction of the price movement of the entire market or specific security.
The trend has a fundamental importance when deciding whether to buy or sell,
because one of the basic principles of technical analysis is that investing
should always be in line with the trend (direction of price movement).
Due to the duration of the trends can be divided into:
- long-term (main, first-class) - lasting from several months to several years
- medium-term (secondary) - lasting several months
- short-term (tertiary) - lasting several weeks.
The above mentioned principle of investing in line with the
trend refers primarily to the main trend.
If the trend line is determined by bottom points- we are talking about
an uptrend, if by the tops - we are talking about a downward trend.

Due to the direction of price movement, trends can be
distinguished:
- rising - always determined by price minima
- descending - always marked by peaks
- horizontal - determined by pits or peaks.
Game tactics
Always at the beginning of the analysis you should set the
trend lines on the graph and invest in accordance with the main trend.
Important information about trends:
- Main trends usually last for a long period of time and during this time share prices go a long way.
- Huge profits could be achieved by buying bear market at the bottom, and selling at the very top of the bull market, you would have to be very lucky to hit exact prices.
- By analyzing trends it is possible to avoid buying at the end of the bull market.
- It is possible to make profits on investments consistent with the main trend, in the secondary trend (aka short term trend), and sometimes even on securities that move against the main trend.
- The largest and most reliable profits can be achieved by investing in the main trend for the greater part of its duration, but not in the initial or final phase of this trend. Therefore, capital should be invested to the greatest extent in the middle phase of the main trend.
Upward trend:
In order to determine the upward trend, two price bottoms should be distinguished (1.2), with the latter having to be set at a higher
level than the first. These bottoms or bouncing spots must be separated by at 5 periods. Confirmation of the trend occurs when the next bottom price (3) is created on
this line or near it.

There are three criteria for the importance (in the
technical sense) of the upward trend:
- number of confirmations: a larger number of bottom on the line or near it indicates a greater trend strength, i.e. each trend test emphasizes its importance
- distance between points determining trend: the greater the distance (in time) between bottoms, the stronger the trend
- tilt angle: the less steep the trend line is, the greater its significance (the more difficult the trend will be broken and the more important is the sales signal after breaking the trend).
The sales signal is generated if the price is pushing down
the trend line
Note 1: A very large increase in the volume of turnover when
the trend line breaks, and then an immediate return of the course to this line
may indicate a false sales signal.
Note 2: At the beginning of the main upward trend, the
correctly determined line usually runs through the second and third minimum
(and not the first and second). The volume of turnover should confirm the
trend, ie it should achieve higher values when the exchange rate sets new top.
The downward trend:
In order to determine the downward trend, two tops should
be distinguished (1,2), while the second must be set at a lower level than the
first. These maxima must be at least a 5 period apart. Confirmation of the trend
occurs when the next top price (3) is created in its line.

There are three criteria for the validity (in the technical
sense) of the downward trend:
- number of confirmations: a higher number of peaks on or near the line indicates a greater trend strength, i.e. each trend test emphasizes its importance
- distance between points determining the trend: the greater the distance (in time) between the peaks, the stronger the trend
- Tilt angle: the less steep the trend line is, the greater its importance (the more difficult the trend will be).
Note 1: Pushing up the downward trend line is not a buy
signal (it can be treated as a preparation signal).
Note 2: If you are breaking a trend line up, get ready to buy - wait for
other buy signals.
The volume of turnover should confirm the trend, ie it
should reach higher values when the rate sets new bottom.
Horizontal trend:
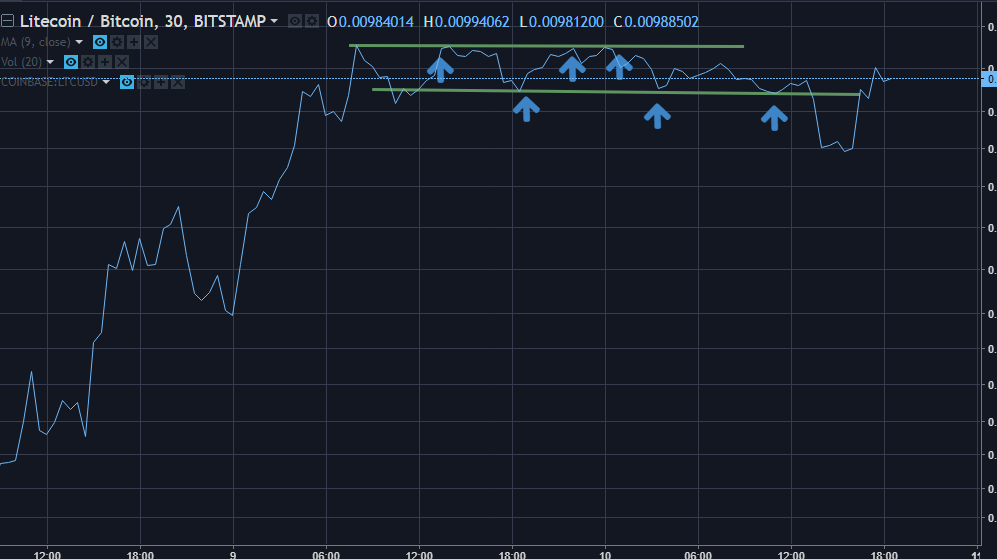
There are two criteria of validity (in
the technical sense) of the horizontal trend:
- number of confirmations: a greater number of turning points on or near the line indicates a greater trend strength, i.e. each trend test emphasizes its significance
- the distance between the points determining the trend: the greater the distance (in time) between the turning points, the stronger the trend.
The sales signal is generated if
the rate is breaking down the trend line. A buy signal is generated
if the rate raises up the trend line with a significant increase in
the volume of turnover.
0 comments:
Post a Comment